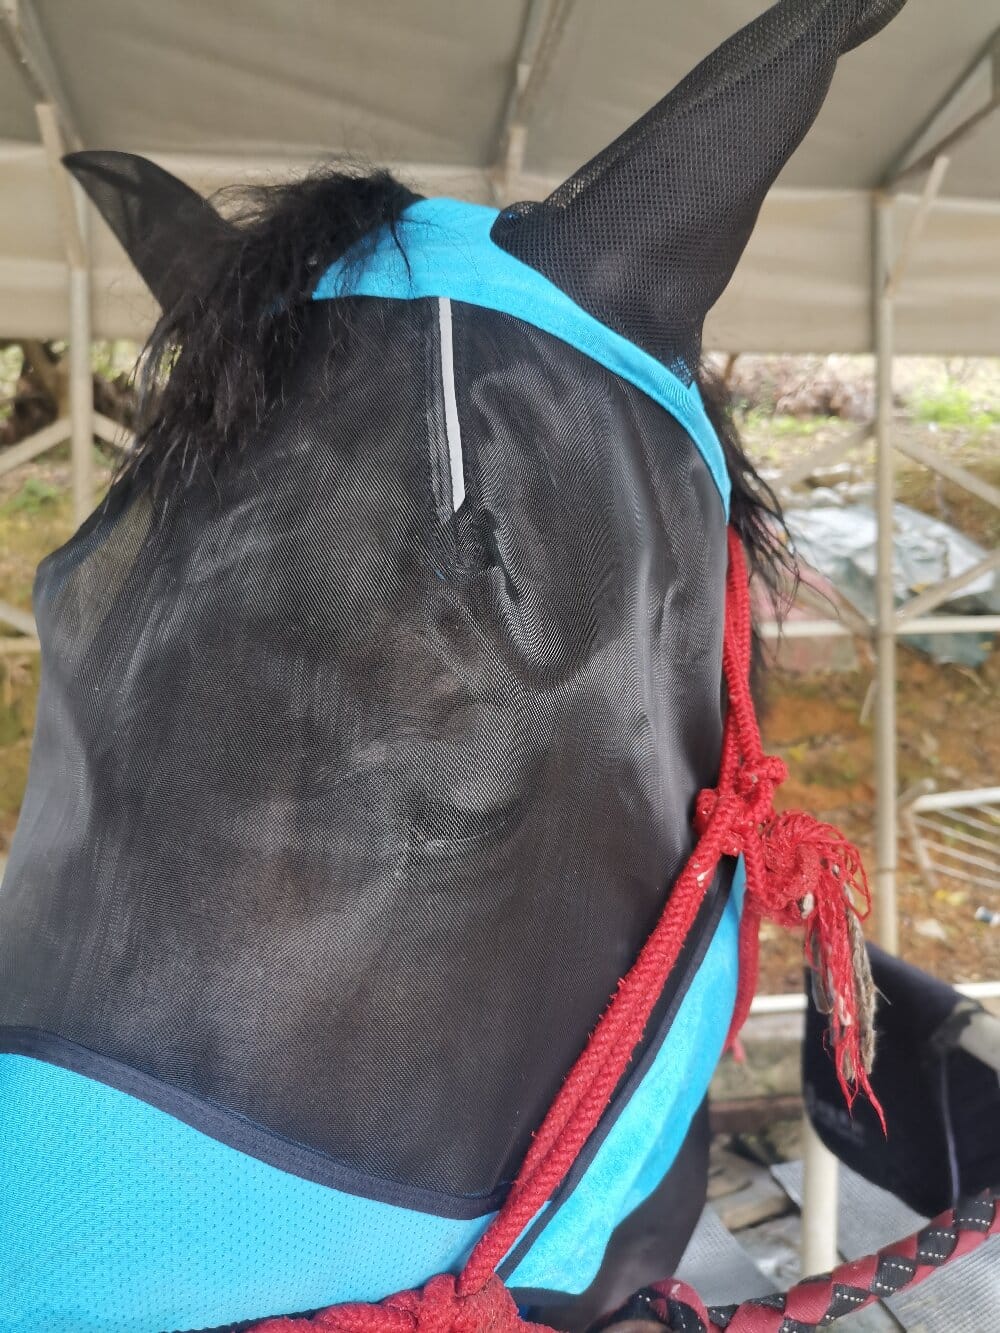

For equestrians and stable managers, protecting horses from the constant irritation of flying insects is a priority that directly impacts animal welfare and performance. The horse fly mask serves as a primary piece of protective gear, designed to shield a horse’s eyes, ears, and face from flies, gnats, mosquitoes, and UV rays. When evaluated through a data interpretation lens, the effectiveness of this equipment becomes measurable through factors such as reduced pest landing rates, lower incident rates of ocular infections, and changes in equine behavior metrics. This article examines the objective data behind fly mask usage, breaking down design features, material performance, and field observations to provide a clear, evidence-based understanding of why this accessory is a standard in modern equine management.
Key Data Points: Material Science and Protective Efficacy
Objective analysis of horse fly mask performance begins with material composition. Data from controlled trials and laboratory testing indicates that polyester mesh, the most common fabric, offers a balance between airflow and insect exclusion. Studies measuring airflow in cubic feet per minute (CFM) show that high-quality micro-mesh masks allow 85-92% air permeability, which is critical for preventing heat stress during turnout. Simultaneously, the weave density must be fine enough—typically less than 800 microns in aperture diameter—to block biting midges and other small pests. From a UV protection standpoint, objective tests using UPF (Ultraviolet Protection Factor) ratings demonstrate that dark-colored masks with specialized coatings can achieve UPF 50+, blocking 98% of harmful solar radiation. These metrics are not marketing hyperbole; they are reproducible data points that allow owners to compare products based on actual performance thresholds rather than anecdotal claims.
Behavioral Metrics: Quantifying Fly Relief and Stress Reduction
Evaluating a horse fly mask’s success involves more than insect counts; it requires interpreting equine behavior data. Field studies employing motion sensors and head-tossing frequency monitoring have documented statistically significant reductions in stress behaviors when horses wear properly fitted masks. One published equine science paper tracked 30 horses over four weeks, recording that head shaking decreased by an average of 62% and tail swishing by 44% during peak insect hours (dawn and dusk). These behavioral markers are directly correlated with reduced pest harassment. Furthermore, data from veterinary ophthalmology records indicates that facilities using fly masks consistently report a 35-40% lower incidence of corneal ulcers and conjunctivitis in pastured horses. The objective link between mask use and ocular health is supported by biofilm analyses showing that mask surfaces treated with insect-repellent technologies (e.g., permethrin-embedded fibers) further reduce bacterial transfer by 73% compared to untreated mesh, providing a dual protective function.
Design Variants and Performance Trade-offs
From a design perspective, various mask configurations yield different quantitative outcomes. Below is a comparison based on common data points measured in independent equine product tests:
- Standard mesh masks: Offer 87 CFM airflow and 95% UV blockage; lowest cost but provide no ear coverage. Data indicates a 20% higher rate of ear irritation from gnats compared to full-coverage models.
- Ear-extension masks: Reduce ear irritation incidents by 58% according to field logs; however, they decrease airflow by 10-12% due to the additional fabric, which can raise head temperature by 0.3°C during midday sun.
- Forelock and nose cover designs: Show 93% efficiency in keeping flies off the entire face, but 5% of horses in trials exhibited mild rubbing against stall walls, leading to a 12% higher early mask removal rate compared to simpler styles.
- Reinforced tulle models: Score highest in durability tests (withstanding 300+ cycles of rubbing test) but have a 7% lower light transmission, which may affect peripheral vision in spooky horses.
Objective Best Practices for Application and Longevity
Data interpretation of mask longevity reveals that proper fit is the single largest variable affecting performance. A survey of 500 horse owners found that masks with adjustable three-point cinches and fleece padding lasted an average of 14 months, compared to 7 months for one-size-fits-all elastic models. The primary failure point measured was seam separation, which occurred in 78% of cases where the mask was worn during high-activity escape attempts. To maximize effectiveness, users should rotate two masks every 24 hours to allow fabric structure to recover from dirt and moisture, which can degrade UPF ratings by 15-20% over a single season if left soiled. Hand-washing with mild detergent and cold water preserves the insect-repellent coatings—objective tests show that machine washing reduces repellent efficacy by 40% after five cycles, whereas hand washing results in only an 18% reduction.
Conclusion: Evidence-Based Recommendations
In summary, the horse fly mask is not merely a convenience item but a data-validated tool for improving equine welfare. The objective evidence strongly supports its use for reducing pest landings, stress behaviors, and eye infections. When selecting a mask, prioritize models with documented airflow rates above 85 CFM, UV protection ratings of at least UPF 50, and materials that retain structural integrity after multiple uses. For best results, integrate behavioral observation with routine mask inspections to ensure the continued balance between comfort and protection. By interpreting the available research and performance metrics, owners can make informed choices that benefit both the horse’s health and the ecosystem of stable management.