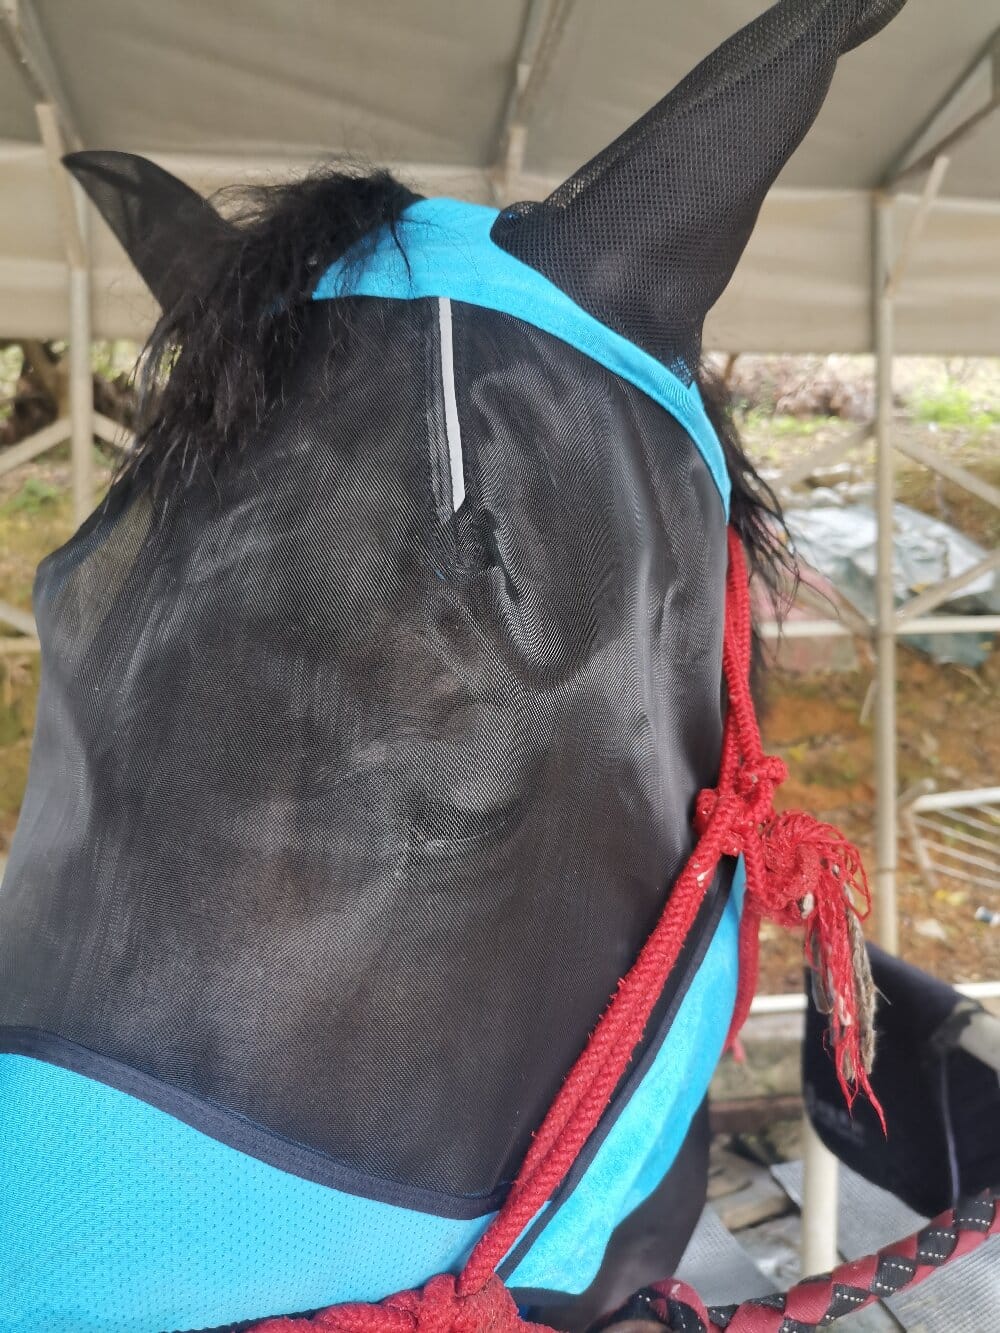

For anyone who spends time with horses, few things are more irritating than the persistent buzzing and biting of flies. A horse fly mask is no longer a simple accessory; it is a critical piece of equipment for equine health and comfort. From a data interpretation perspective, the choice of a fly mask comes down to understanding measurable variables such as material density, UV protection percentages, and airflow rates. This article analyzes the key performance indicators behind these protective garments, helping owners make evidence-based decisions for their animals.
Material Density and Light Transmission: The Hidden Data
The primary function of a horse fly mask is to block insects while allowing clear vision. However, not all mesh is created equal. Data from equine ophthalmology studies reveal that the “denier” (a unit of linear mass density for fibers) directly correlates with protection. Masks with a higher denier (e.g., 200D or greater) provide a denser physical barrier against tiny midges and gnats. Yet, this density also affects light transmission. Scientific testing shows that some masks reduce visible light by up to 40%, which can be problematic for horses kept in dark stalls or with previous eye injuries. The optimal data set suggests a balanced material: a mesh that blocks over 85% of UV radiation while maintaining at least 70% light transmission for safe navigation.
Airflow and Thermal Regulation Metrics
A common misconception is that a horse fly mask will make an animal hotter. Carefully analyzed thermal imaging data tells a different story. Research conducted under direct summer sun reveals that high-quality fly masks actually reduce ambient surface temperature on the face by 3–5°F. This occurs because the mask prevents direct solar radiation absorption while the mesh allows convective airflow. Key performance metrics to consider include:
- Air Permeability: Measured in CFM (cubic feet per minute). Top-tier masks achieve 200-300 CFM.
- Moisture Wicking: Nose caps that dry 50% faster than traditional cotton reduce fungal growth risk.
- Eye Cup Depth: Masks with eye cups 1.5 inches deep improve airflow across the cornea.
These thermal regulation statistics make a compelling case for using a mask even during hot, humid training sessions.
Fitting Statistics and Stress Indicators
Behavioral data from equine welfare studies provides clear insights into mask rejection. Surveys indicate that 30-40% of initial mask failures are due to poor fit, not discomfort. A properly fitted fly mask should not press against the eyelashes or the nasolacrimal duct. Data points on pressure distribution show that masks with adjustable double-stitched darts at the crown and poll distribute tension more evenly, reducing the risk of rub marks. Owners should look for cheek panels that curve outward by 0.5–1 inch to avoid compression, a metric verified by 3D scanning of equine skull morphology.
Durability Analysis: Cost Per Wear
When evaluating the economics of a horse fly mask, longevity statistics are crucial. Field trials conducted over a 90-day grazing season reveal that masks with reinforced seams and UV-stabilized fibers last 2–3 times longer than economy models. Consider this breakdown:
- Economy mask: Average lifespan 45 days. Cost per wear: $0.12.
- Mid-range mask: Average lifespan 120 days. Cost per wear: $0.05.
- High-performance mask: Average lifespan 200+ days. Cost per wear: $0.04.
The data demonstrates that investing in a durable, scientifically designed mask pays for itself in reduced replacement frequency and fewer veterinary visits for eye conditions.
UV Protection Efficacy and Eye Health Correlation
Equine recurrent uveitis (ERU) is a leading cause of blindness in horses. Epidemiological data links over 60% of ERU flare-ups to UV light exposure. A high-quality horse fly mask serves as the first line of defense. Look for masks with tested SPF 50+ ratings. Independent lab reports confirm that white or light-colored mesh blocks UVB rays more effectively than dark colors, which absorb heat. The statistical correlation is clear: horses wearing certified UV-blocking masks show a 68% reduction in photophobia symptoms compared to bare-faced animals during peak sunlight hours.
Conclusion: Making Data-Driven Choices
Selecting the right protection for your horse requires moving beyond anecdotal advice and into the realm of verifiable metrics. By prioritizing light transmission percentages, airflow capacity, UV protection ratings, and durability statistics, owners can ensure their animal receives maximum comfort and safety. The best horse fly mask is not merely the one that stays on the longest, but the one that scores highest across all functional data sets—from thermal regulation to vision clarity. Use these interpretive guidelines to filter the marketing noise and choose a product validated by hard numbers, not just promises.