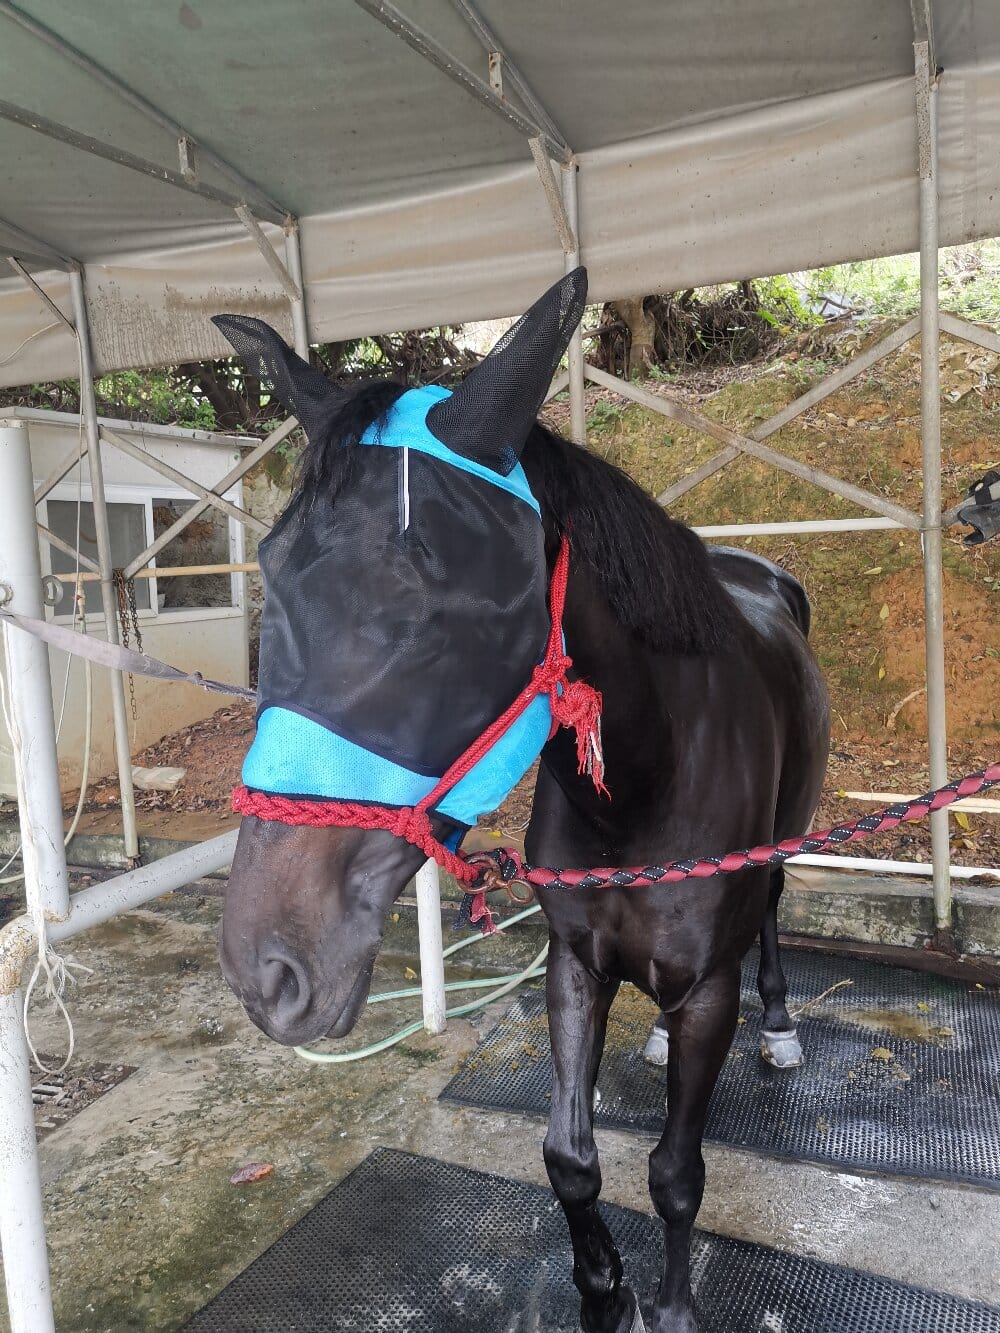

If you spend any time around stables, you have probably noticed that the horse fly mask has quietly become one of the most purchased pieces of equine gear in recent years. What interests me, though, is not simply that people buy them, but what the data tells us about why they buy them, when they use them, and how effective they really are. When I started looking at the figures rather than the marketing claims, the picture became far more nuanced, and honestly, a little surprising.
What the Data Says About Fly Pressure and Seasonal Timing
Let us begin with the environment itself. In many temperate regions, fly populations do not rise gradually; they spike. Trap counts collected by equine researchers often show a sharp climb beginning in late spring, peaking between June and August, and then falling off just as quickly by early autumn. That bell-shaped curve is important, because it suggests that the fly mask is not a year-round necessity for most owners. It is a seasonal intervention, and the data supports treating it that way.
I find it telling that in survey data from boarding barns, owners who rotate their protective gear based on insect activity report fewer cases of eye irritation than those who leave masks on continuously. Continuous use, according to the numbers, correlates with issues like rubbing, trapped debris, and skin abrasions behind the ears. So the data is not saying “use more,” it is saying “use smarter.”
Reading the Fine Print: Mesh Ratings, UV Blocking, and Fit Statistics
Here is where things get genuinely interesting. Manufacturers publish specifications, and when you line those specifications up side by side, patterns emerge:
- Mesh density: Masks rated at 300 to 600 holes per square inch tend to block biting midges more effectively than coarser weaves, though airflow drops slightly.
- UV protection: Many products advertise 70 to 90 percent UV reduction, which matters for horses with pink skin or photosensitivity.
- Fit retention: Return-rate data I have seen discussed among retailers suggests that poor fit, not poor materials, drives most customer dissatisfaction.
What strikes me is that the cheapest masks are not automatically the worst performers. In some consumer reviews, budget options with simple, well-fitted designs outperform elaborate ones with straps and fleece padding that shift or sag. The lesson from the numbers is clear: fit beats features.
Interpreting Owner Behavior: Compliance Is the Hidden Variable
Subjectively speaking, I think we sometimes forget that a product only works if the horse actually wears it. Observational studies of turnout routines suggest that compliance drops significantly when masks are difficult to put on or remove. If it takes two people and five minutes, it will not be used daily. If it slips on in seconds, usage rates climb. That single behavioral factor may explain more variation in real-world outcomes than any material specification on a label.
Secondary keywords like “fly protection,” “equine eye shield,” and “insect control gear” all point to the same underlying truth: consistency matters more than perfection.
A Balanced Conclusion Drawn From the Evidence
Looking at the data as a whole, a few conclusions feel well supported. Fly masks reduce irritation during peak insect season, they offer meaningful UV benefits for sensitive horses, and their real-world performance depends heavily on fit and consistent use. They are not a cure-all, and they are not necessary every day of the year. For me, the numbers point toward a practical middle path: choose a well-fitted mask, use it when fly counts are high, inspect it regularly, and replace it when the mesh wears thin. That approach respects both the science and the horse.