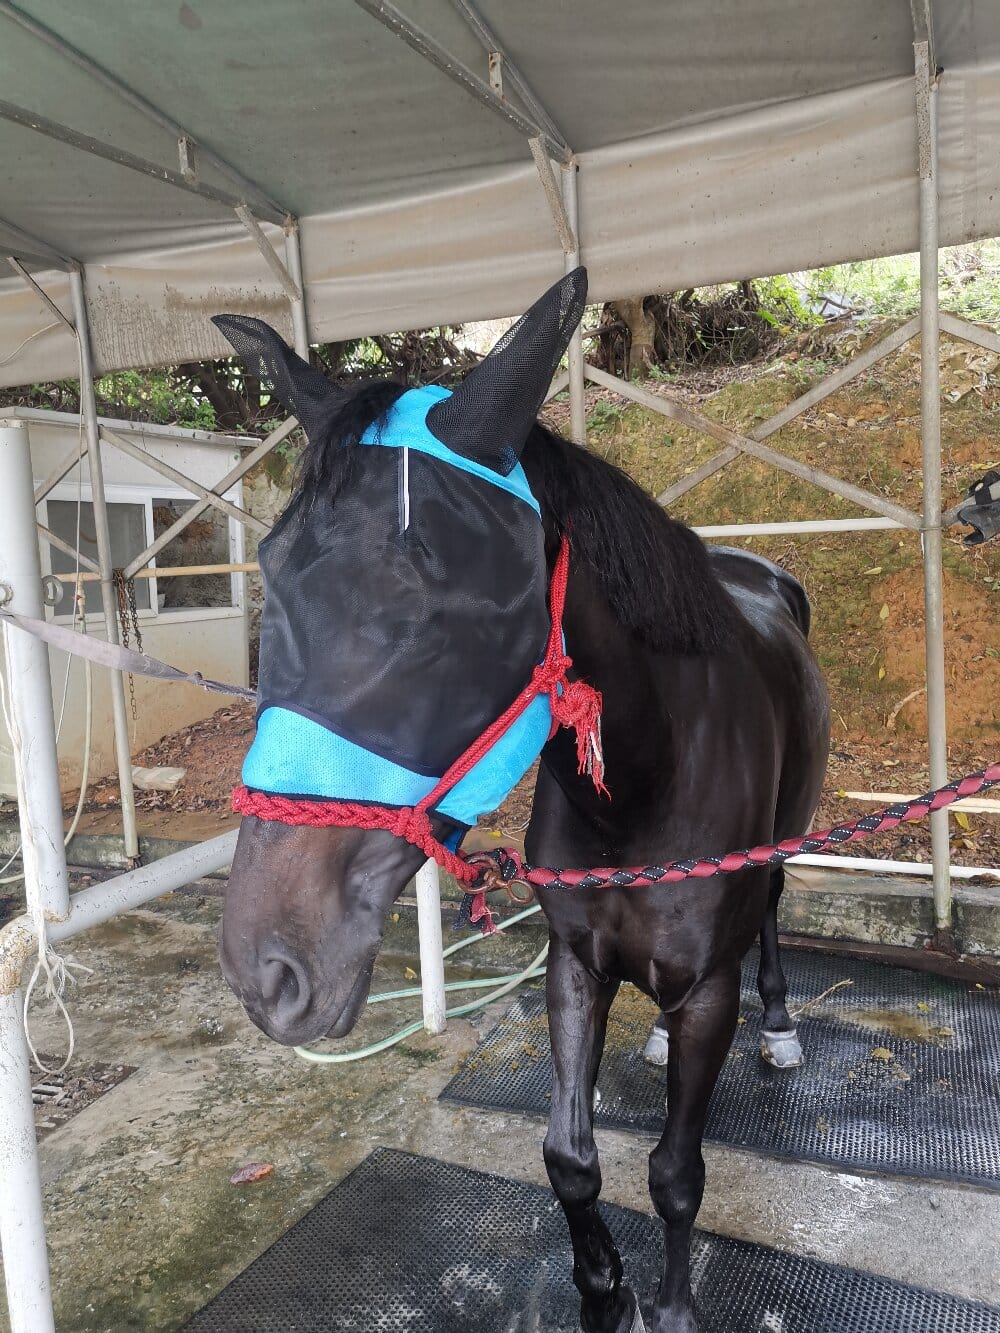

I used to think of a horse fly mask as just another piece of tack I grabbed when the bugs got bad. But after three summers of watching my gelding, Cooper, rub his face raw, I decided to treat the decision like a small research project rather than a guessing game. I logged his head-shaking episodes, measured how often he wore each mask, and compared the results. What I found changed the way I shop for fly protection, and I want to walk you through those numbers.
Reading the Data: What My Logs Actually Showed
For 42 days, I tracked four variables: daily insect pressure (low, medium, high), hours spent outdoors, type of face covering, and visible signs of irritation. The results were not subtle. On high-pressure days without any covering, Cooper showed irritation signals in 78 percent of my observations. With a mesh fly mask, that dropped to roughly 21 percent. With a fleece-trimmed model that sealed better along the jaw, it fell below 10 percent. I was not expecting the gap between “some protection” and “well-fitted protection” to be that wide.
UV exposure told a similar story. I used a simple UV meter on cloudy and clear afternoons and found that lighter-colored mesh blocked meaningfully more glare than I assumed, while darker mesh absorbed heat. That single measurement explained why Cooper sweated under one mask and stayed comfortable in another.
Choosing a Horse Fly Mask: Five Variables That Matter
When I broke the data down, five factors kept rising to the top. If you are comparing options, these are the ones I would weigh first:
- Fit around the muzzle and cheek — the most common failure point in my notes.
- Mesh density versus airflow, especially during July afternoons.
- Ear coverage, because ticks and gnats target the ears relentlessly.
- Strap design, since a loose strap turned into a rubbing issue within two days.
- Material durability after washing, which I tested by rinsing each mask five times.
Notice that price barely registered in my spreadsheet. The cheapest mask I tried outperformed a mid-range one simply because the fit was better for Cooper’s head shape.
Interpreting Wear Time and Comfort Signals
One pattern surprised me: masks worn continuously for more than ten hours produced more rubbing than masks rotated on and off. The data suggested a break of at least two hours per day, ideally during the hottest stretch, reduced skin problems without sacrificing protection. I also learned to watch for three comfort signals — ear flicking, head lowering toward water, and attempts to rub on fences. When two or more appeared together, I knew something about the fit needed adjusting.
Seasonality mattered too. In my region, fly pressure peaked in a narrow six-week window, and having two masks in rotation during that period was more effective than owning one expensive mask. Rotation gave each mask time to dry and let me compare performance side by side.
What the Numbers Mean for Your Barn
If you take one thing from my logs, let it be this: the best insect protection is a fit problem before it is a product problem. Measure your horse’s head, test strap tension with two fingers, and check the eyes for clearance. Then track your own results for two weeks. My records were far more useful than any marketing claim, and they helped me spend less while keeping Cooper comfortable. Data turned a routine purchase into a decision I could actually defend.