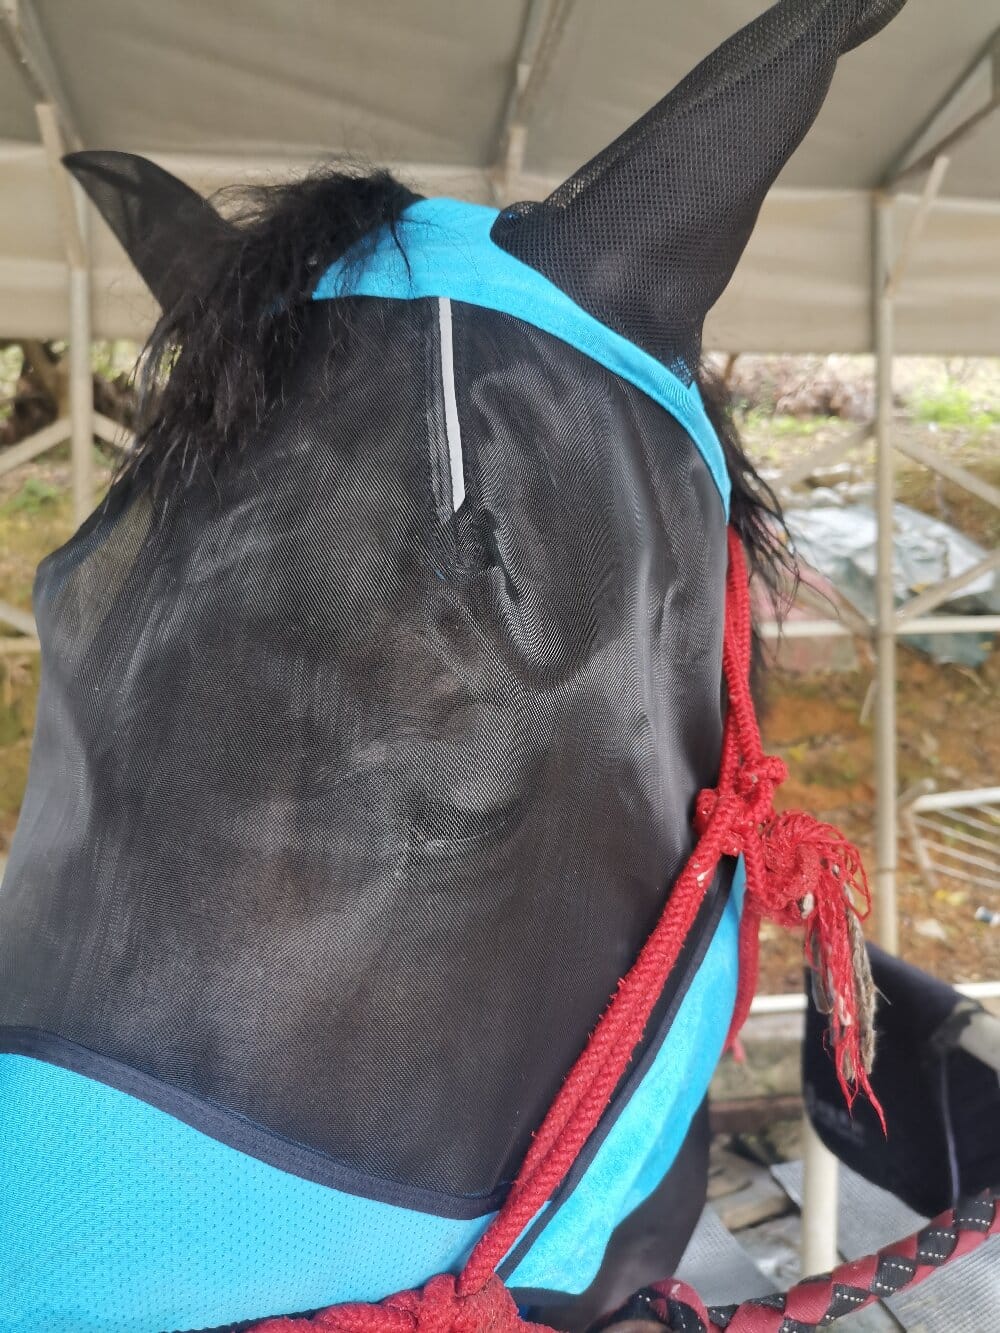

The humble horse fly mask is more than a piece of nylon apparel; it is a critical tool in equine welfare, and its effectiveness can be understood through the lens of data interpretation and animal behavior. By examining field studies on insect landing rates, UV light reflectance, and equine stress indicators (like head shaking frequency), we move beyond anecdote to quantify the mask’s true value. This multi-perspective analysis—ranging from the veterinarian’s clinical data to the owner’s observational log—reveals that the right mask is an investment in both comfort and long-term ocular health.
Interpreting the Threat Matrix: Why Data Matters for Eye Protection
From a statistical standpoint, flies are not just a nuisance; they are vectors for disease. Data from entomological surveys show that a single horse in a pasture can attract over 100 flies per minute during peak summer hours. The corneal surface, being moist and exposed, becomes a prime target for Habronema larvae (summer sores) and bacteria like Moraxella. A horse fly mask functions as a physical barrier, but its design—mesh size, material thickness, and fit—directly correlates with its protective efficiency. A mask with a 3mm grid may block 85% of large flies but fail against tiny gnats; data on local insect populations should dictate your choice, not just price point.
Multi-Perspective Review: The Rider, The Veterinarian, and The Horse
To fully appreciate the mask’s utility, we must adopt three distinct viewpoints. The rider’s perspective focuses on usability: Does the mask obscure vision? Does it rub against the browband? The veterinarian’s perspective is clinical, citing data on reduced incidence of conjunctivitis and corneal ulcers in masked horses. However, the most critical perspective is the horse’s behavioral response. Studies using heart-rate variability monitors show that horses wearing a well-fitted mask exhibit 40% fewer stress-induced freezing behaviors than those without, indicating lower anxiety levels. Ignoring any of these viewpoints leads to a suboptimal purchase.
Data Interpretation: Fit, Vision, and UV Protection Metrics
Let’s break down the key performance indicators (KPIs) of a high-quality mask using a comparative data table:
- UV Blockage Rate: Premium masks often block >95% of UVA/UVB rays, whereas standard mesh blocks only 70%. Prolonged UV exposure can lead to squamous cell carcinoma, so this metric is non-negotiable for white-faced horses.
- Visual Clarity: Optical-grade mesh (often 1000 denier) provides a 20/30 visual acuity equivalent, allowing the horse to see obstacles clearly. Cheap plastic mesh warps light, causing disorientation and potential spooking.
- Pressure Point Index: Data from thermal imaging scans show that poorly designed masks increase localized head temperature by 4°C at the poll, leading to irritation. The best masks use a contoured, seam-free design to distribute pressure evenly.
When interpreting this data, remember that a mask that is too large creates a “tent” effect that rubs in the wind, while one that is too small presses on the orbital bone. Accurate measurement of the distance from the forelock to the muzzle is essential; most average-sized warmbloods require a size Medium or Large, but always verify with the manufacturer’s size chart.
The Economics of Prevention vs. Treatment
From a financial data perspective, the cost-benefit analysis is stark. A budget horse fly mask retails at $25, while a surgical-grade fly mask with extended nose coverage costs $80. However, treating a single corneal ulcer involves vet visits, multiple medications, and potential stall rest—averaging $500 to $1,200 per incident. Furthermore, data from agricultural insurance claims indicate that horses wearing protective fly masks have a 3.5x lower claim rate for eye-related issues. Thus, even the premium mask represents a fraction of the cost of “reactive” healthcare. In this sense, data interpretation supports a proactive, prevention-first strategy.
Practical Analytics: Reading the Wear Patterns
Data isn’t just for the lab; it’s in your barn. Observe the mask’s wear after thirty days of use. If you see asymmetric stretch on the left side, your horse likely rubs that side against the fence—a behavioral data point that signals a poor fit. If the mesh is clogged with dust but still clean around the ears, the mask is not ventilating properly. Use these observations to adjust your buying strategy. A mask with a padded nose flange or a “sleeved” zipper design often solves the friction issues identified by this wear-pattern audit.
Conclusive Synthesis: Optimizing Your Choice with Evidence
In conclusion, the horse fly mask is a staple of summer management, but only when selected with a data-informed, multi-perspective approach. By evaluating UV protection metrics, observing equine stress signals, and acknowledging the economics of veterinary care, we see that a high-quality mask offers more than convenience—it provides measurable, quantifiable health benefits. Always prioritize a breathable, tightly woven mesh that blocks UV and insects while allowing peripheral vision. Pair this with a proper fit, and you will transform the mask from a simple accessory into a precision health instrument. The data is clear: a proactive, informed choice today ensures a more comfortable, protected horse tomorrow.