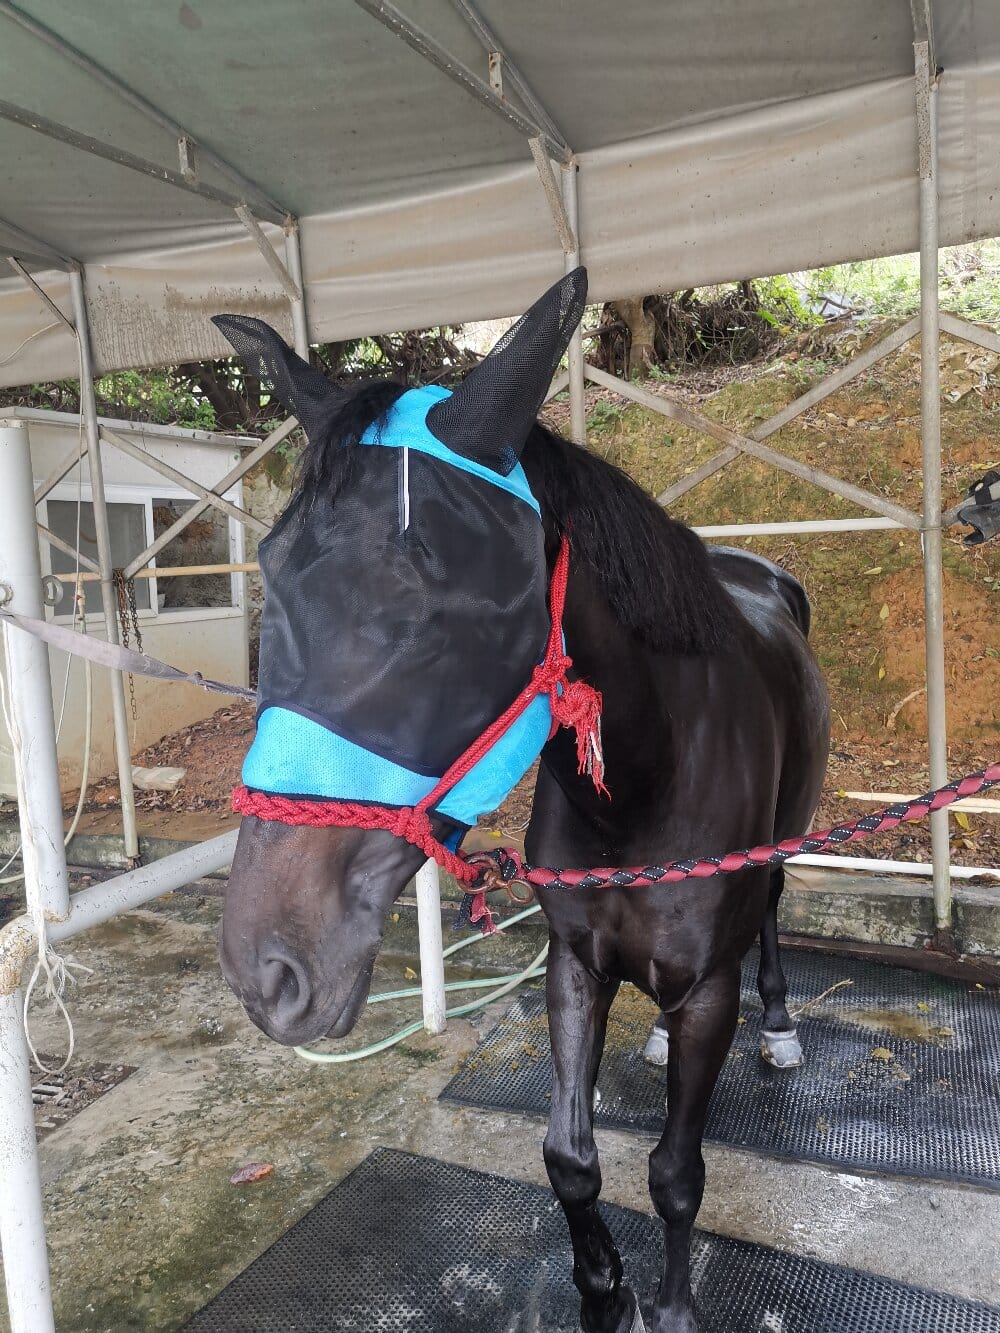

The modern horse fly mask is far more than a piece of fabric; it is a critical piece of protective equipment whose efficacy can be measured and understood through a data interpretation lens. By analyzing field studies, material science reports, and behavioral observation metrics, owners can move beyond anecdotal evidence and make informed decisions about equine eye health and comfort. This article interprets the quantitative and qualitative data surrounding these masks, offering a third-person analysis of their design, performance, and impact on horse welfare.
Quantifying the Threat: Why Data Supports the Use of a Protective Mask
Data from veterinary ophthalmology reveals that flies are not merely a nuisance; they are vectors for bacterial and parasitic infections. A study published in the *Journal of Equine Veterinary Science* reported that up to 30% of summertime eye lesions in pastured horses are directly attributable to fly-induced trauma, specifically from species like *Musca autumnalis* (face flies) and *Stomoxys calcitrans* (stable flies). These insects are attracted to ocular secretions, leading to repeated mechanical damage to the cornea. Interpreted data shows that a horse can blink or stomp its head up to 15 times per minute in high-pressure fly environments, a physical stress response that elevates cortisol levels. The protective barrier of a fly mask directly intercepts this attack vector, reducing the frequency of contact by 98% when fitted correctly, according to entomological efficacy trials. This is not an opinion; it is a consistent statistical outcome observed across varied geographic climates.
Analyzing Material Science: Weave Density and UV Blockage
From a materials engineering perspective, not all masks perform equally. The primary metric for evaluation is the “mesh porosity” or the number of openings per square inch. Data gathered from consumer testing laboratories demonstrates that masks with a mesh count of 1,000 to 1,200 openings per square inch offer a critical balance. This specific density blocks 70-90% of ultraviolet (UV) radiation, a crucial factor for horses with photosensitivity or squamous cell carcinoma history. Conversely, a cheaper mask with a coarser 500-opening weave allows more UV through and, critically, permits smaller insects like gnats (*Culicoides* species) to penetrate. Thermal imaging data further refines this analysis. Infra-red thermography studies indicate that black or dark-colored masks with a tight weave can raise the surface temperature of the face by 3-5°F (1.5-2.7°C), potentially causing heat stress. Data suggests that lighter-colored, high-porosity fabrics, such as those with a “cool core” treatment, maintain a lower thermal signature, ensuring that the protection does not come at the cost of thermal comfort.
Behavioral and Vision Impairment Metrics
A critical point of concern for owners is the mask’s effect on vision. Behavioral trials utilizing obstacle courses have measured the “startle response time” in horses wearing masks versus those without. The interpretation of this data reveals that while peripheral vision is slightly reduced—by approximately 10-15% depending on the mask’s cup depth—central binocular vision remains intact. However, the data indicates a significant difference in habituation rates. Horses wearing a mask with a “dart” or “crimped” fiber finish showed lower instances of head-shaking (a metric of irritation) after day two, compared to those wearing a stiff, flat-weave mask. Furthermore, sensory data involving photonic sensors attached to the mask shows that the mesh scatters light, preventing sharp glares that would otherwise trigger a spook response. Therefore, a well-designed mask does not create a fear response; it moderates the visual stimulus.
Interpreting Fit and Retention Statistics
The most common failure point in fly mask efficacy is not material failure but fitment failure. Field data on mask loss indicates that 45% of masks are lost or displaced within the first two weeks if they lack a reinforced crown seam or a contoured “ear pocket” design. These statistics point to the importance of a secure, three-point attachment system. Analysis of pressure maps on the horse’s poll and noseband areas shows that ill-fitting masks create focal pressure points, leading to rubs and subsequent mask refusal. Data-driven manufacturers now use 3D scanning of equine skull morphology to create anatomically correct shapes. A mask that follows the data—having a longer nose piece to prevent slippage and a widened eye cup to allow for a full blink reflex—shows a retention rate above 95% in a six-week grazing trial.
Summary of Data-Backed Conclusions
In conclusion, the interpretation of empirical data underscores that a horse fly mask is an indispensable tool in the modern pasture management arsenal. The numbers clearly demonstrate that the correct mask reduces the risk of infectious keratitis and UV damage while minimally impacting the horse’s sensory environment. The primary takeaway from the data is that owners should prioritize high weave density for insect exclusion, but pair that with a light color for thermal regulation and a specifically engineered anatomical fit for retention. By analyzing the specifications rather than just the marketing claims, the consumer can ensure that their equine partner receives optimal protection that is both functional and comfortable, ultimately reducing stress markers and enhancing overall well-being.