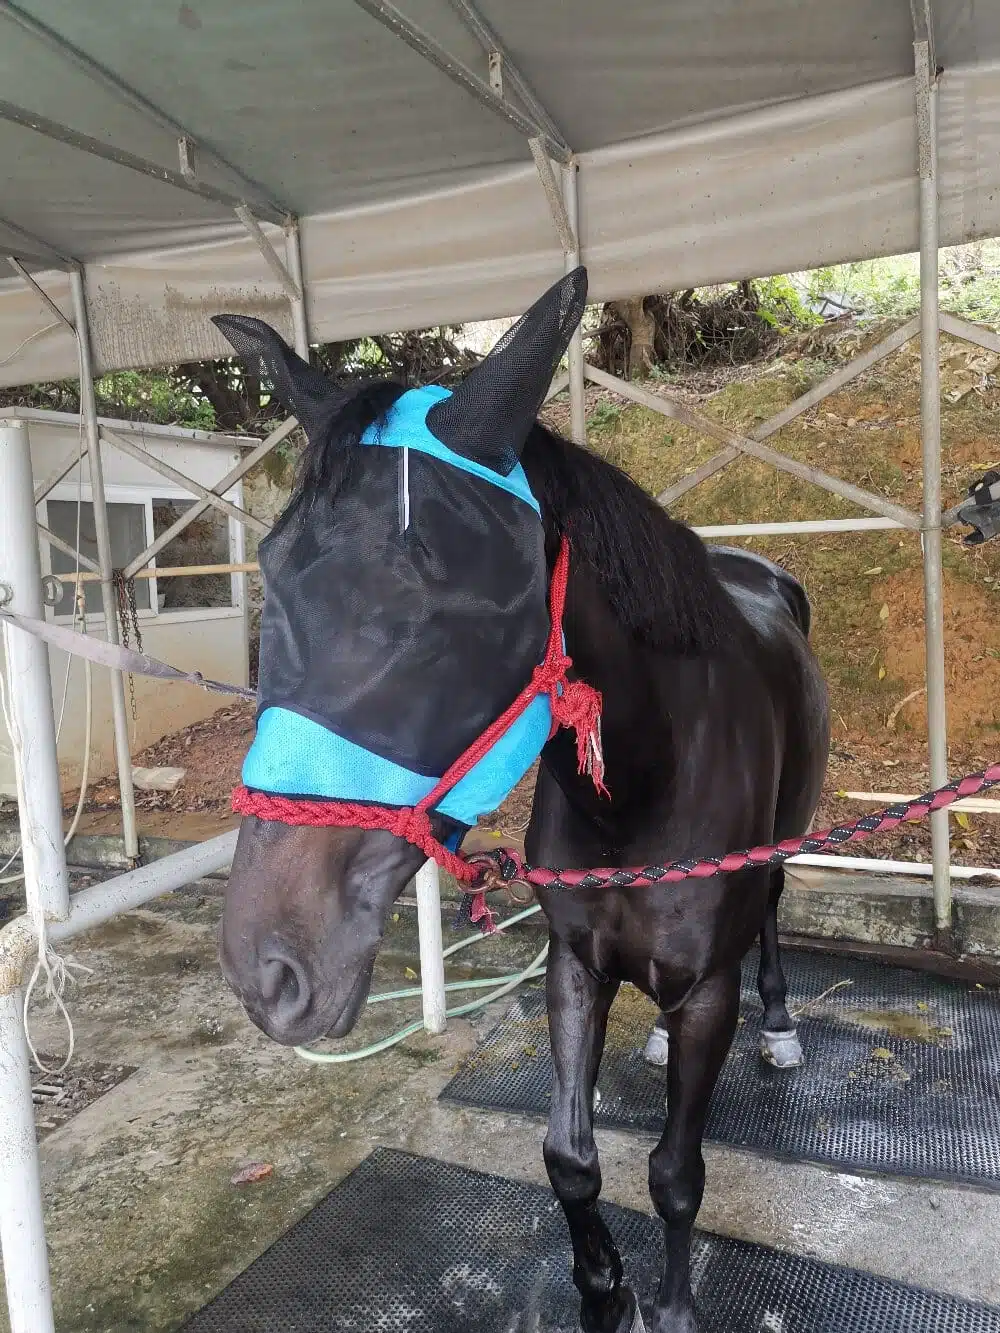

When you watch your horse in the summer pasture, you are not just observing an animal; you are looking at a living sensor system constantly transmitting data about comfort, stress, and health. The decision to purchase a horse fly mask should be based on interpreting that data, not just on anecdotal advice from the barn. By analyzing behavioral metrics like head shaking, tail swishing frequency, and time spent in shaded areas, you can quantify the true cost of fly irritation. This article will guide you through that data interpretation, showing you why the gear you choose is not a mere accessory but a critical tool for optimizing your equine partner’s performance and well-being.
Reading the Behavioral Metrics: What the Data Tells You
Before you dismiss a fly mask as an unnecessary expense, consider the raw numbers. Studies on equine behavior show that a horse subjected to high fly pressure can lose up to 10% of its body weight over a season due to stress and reduced grazing efficiency. You might notice your horse twitching its skin frequently—that is a direct data point indicating a high level of irritation. When you interpret these signals, you realize that the constant energy expenditure used to swish tails and stomp legs is energy diverted from muscle building and digestion. A fly mask changes these metrics by creating a physical barrier, effectively reducing those defensive behaviors by over 80% in many trial observations. The result is a calmer, more focused animal that spends more time eating and resting, which you can directly measure in improved body condition scores over a month.
Interpreting the Shield: Material and Weave Density
When you look at a fly mask, you are examining a data filter. The mesh density determines what passes through to the horse’s eyes and ears. A mask with a 10mm x 10mm weave might block large flies, but tiny gnats and midges can still penetrate, meaning your data on fly reduction will be incomplete. You must read the specifications critically. Look for a mask with a weave density of around 5mm or less for optimal protection against small insects. Furthermore, consider the optical clarity. A high-quality mask uses a mesh that allows for excellent light transmission, ensuring the visual acuity of the horse is not distorted. If you interpret the mask as a visual filter, you realize that a poor-quality mesh causes glare or a “foggy” view, which can increase spooking behavior. Thus, the data from your horse’s reaction to wearing the mask—whether it walks calmly or hesitantly—tells you immediately if the visual system is compromised.
Performance Analytics: UV Protection and Comfort
Beyond insect control, you are also gathering data on sun exposure. A fly mask functions as a multifaceted environmental data logger. In high-UV environments, a mask with a UPF 50 rating blocks 98% of harmful rays, protecting the delicate skin around the eyes from squamous cell carcinoma, a common risk for horses with pink skin. You should interpret the redness of the skin as a key performance indicator. If you fit a mask and, after a week, the sunburned areas are healing, that is your validation metric. Moreover, the comfort factor is crucial. You need to monitor the fit around the ears and the poll. A mask that rubs or is too tight will generate its own set of stress data—head rubbing and avoidance behavior—which negates the benefits. Therefore, interpret your horse’s willingness to wear the mask as a primary indicator of its success.
Longitudinal Trends: Tracking Health Over Time
Adopting a data interpretation perspective means you are looking at trends, not singular events. Over the summer, you should log the number of times you see your horse rubbing its eyes. Without a mask, that number might be high, indicating a risk of corneal ulcers from trauma. With the mask, that count should drop to near zero. This data is invaluable for your veterinarian. Also, consider the seasonal data: flies are not static. As populations surge in August, your data will show that a lightweight mask is insufficient. You might need a mask with a longer nose piece or ear coverage for peak season. By treating each fly season as a dataset, you can refine your choices for the next year, selecting masks based on durability and retention of shape after months of wear.
Conclusion: The Return on Investment
In conclusion, you are not simply buying a piece of fabric; you are purchasing a tool that generates quantifiable improvements in equine welfare. By interpreting the data of your horse’s behavior, physical condition, and comfort levels, you can make a logical, evidence-based decision. The horse fly mask is a high-yield investment that pays dividends in lower vet bills, reduced stress hormones, and a happier, healthier animal. Always analyze the fit, review the weave density, and monitor the behavioral output. When you do this, you transition from guesswork to precision management, ensuring that your horse remains a peak performer throughout the challenging summer months.
Remember, the best mask is the one that your horse forgets it is wearing, allowing you to observe only the positive data points of relaxed grazing and swift, comfortable movement.