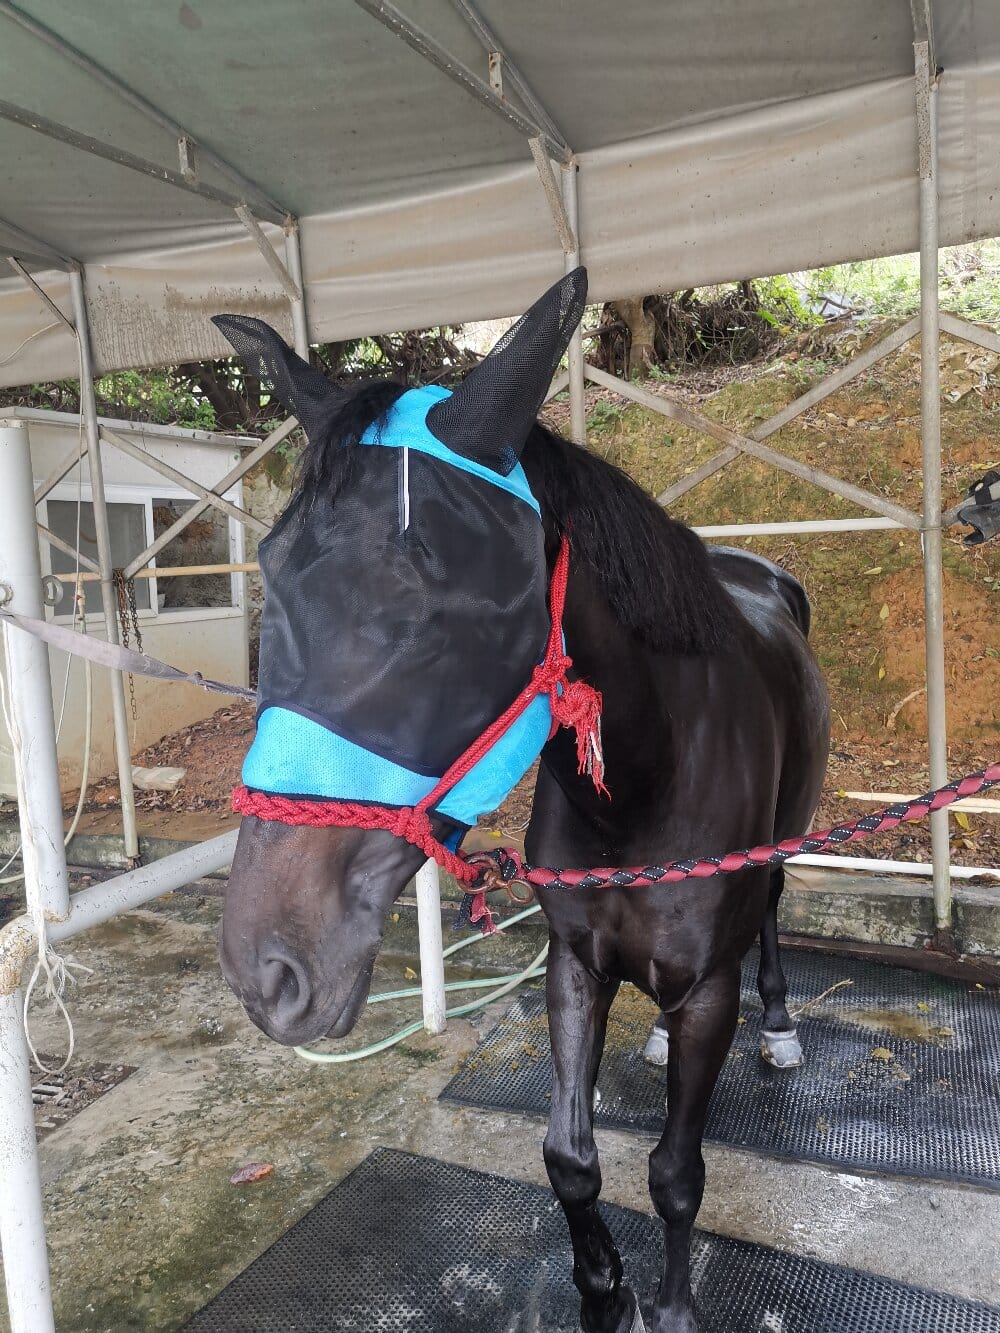

When you look at your horse grazing under a bright summer sun, you might notice a lightweight mesh covering its eyes and ears—that is a horse fly mask. But what if you stopped seeing it as just a piece of fabric and instead viewed it as a data-collection device? From a data interpretation perspective, the mask is not merely a barrier; it is a variable in a complex equation of equine health, behavior, and environmental stress. By analyzing the patterns of fly pressure, the frequency of your horse’s head shaking, and the timing of your pasture management, you can transform a simple accessory into a powerful tool for optimizing your horse’s well-being.
Reading the Raw Data: What Your Horse’s Behavior Tells You
Before you even purchase a mask, you are already collecting data. Observe your horse for a week without any protection. Count the number of times per minute it stomps its feet, swishes its tail, or dips its head into the grass to dislodge flies. Each stomp is a data point. When you average these numbers across different times of day, you’ll likely see a spike between 10 a.m. and 4 p.m., which correlates with peak fly activity. This is your baseline dataset. Now, when you introduce a mask, you can compare the before-and-after averages. If your horse reduces its head-tossing frequency by 70%, the data strongly suggests that the mask is effectively blocking the primary irritant, not just providing psychological comfort.
Interpreting the Material: Thread Count, Fit, and Light Transmission
From an analytical standpoint, not all masks are created equal. You must interpret the specifications printed on the packaging as independent variables. A mask with a mesh hole size of 1mm will block more insects than one with 2mm holes, but it will also reduce light transmission. Here is where the data gets interesting: if you measure your horse’s grazing time under a fine mesh mask versus a coarser one, you might find that the finer mesh reduces visibility slightly, causing the horse to graze 10% less. In that case, the risk of UV damage or fly bites might outweigh the benefit of a dimmer view. You should also look at the fit. A mask that is too tight will show up in your data as increased rubbing against fence posts, while a loose one will fail, showing up as a higher fly-landing count on the cheeks. Always measure the distance between your horse’s ears and its muzzle, and compare it to the mask’s sizing chart as if you were calibrating an instrument.
The Temporal Data: When to Use and When to Remove
Interpretation also involves time-series analysis. Many owners make the mistake of leaving the mask on 24/7, but your horse’s ears and eyes need ventilation. You can track the humidity under the mask using a simple moisture sensor in the browband area. If the relative humidity inside the mask exceeds 85% for more than four hours, you are creating a breeding ground for bacteria, which is a secondary health risk. The smart move is to correlate mask usage with weather data: use it when the temperature is above 65°F and wind speed is below 10 mph, as these are prime fly conditions. When the wind picks up, flies seek shelter, so the mask’s efficacy drops. You can remove it, and the data will show no significant increase in tail-swishing counts, proving that situational use is more efficient than constant wear.
Interpreting the Feedback Loop: Skin Health and Ocular Indicators
You must also interpret the data coming from your horse’s physical response. Check the corners of the eyes daily. If you notice excessive tearing, that is a negative outlier in your dataset, indicating that the mask’s contour is rubbing against the lacrimal duct. Conversely, if you see a reduction in the redness of the conjunctiva compared to unmasked days, that is a positive signal of UV protection. Track these variables on a simple spreadsheet: date, temperature, fly count (estimated), mask on/off, and eye discharge level. Over a month, you will see clear clusters. You might notice that days with high fly counts but low eye discharge correspond directly with mask usage, giving you a causal interpretation: the mask prevents mechanical irritation from fly feet, which is often worse than the bite itself.
Making Data-Driven Decisions for Your Barn
Once you have collected two weeks of comparative data, you can move from observation to prediction. If you know your pasture’s peak fly hours and your horse’s individual reaction threshold, you can schedule turnout accordingly. For instance, if your data shows that your horse tolerates up to 10 fly landings per minute without stress, you can leave the mask off for morning turnout and only put it on for the afternoon peak. This reduces the risk of rub marks and hot spots. Furthermore, you can use this data to evaluate new products. If a friend recommends a different brand, don’t just trust the marketing; run a controlled trial. Wear mask A for three days, then mask B for three days, and compare the stomp data. The mask with the lower stomp count wins. That is the essence of data interpretation—moving from guesswork to evidence.
Conclusion: The Mask as a Metric, Not Just a Gadget
By adopting this analytical mindset, you elevate your role from a passive owner to an active manager. The horse fly mask becomes a metric for environmental pressure and a gauge for your horse’s comfort threshold. You will stop asking “Is this mask working?” and start asking “How well is it working, and under which conditions?” The data will tell you that a well-fitted, appropriately timed mask reduces stress hormones, improves grazing efficiency, and lowers the risk of eye infections. Ultimately, the best interpretation is a simple one: when you let the numbers guide you, the choice of when and how to use the mask becomes clear, precise, and uniquely tailored to your horse’s needs.